To create a custom report, click on the Design report button in the lower right corner of the Reports screen.
Important note about the preview data you can see in the report designer:
The data that is previewed when running the report designer is old data that was cached the last time a report was run.
Explained simply, when running a report data is extracted from the database before FotoWeb filters it to create the report. It is this data that is previewed when you design your report, but this is not live data and is only meant as an aid in helping you correctly design your report. Live data from the database will be used when the report is run.

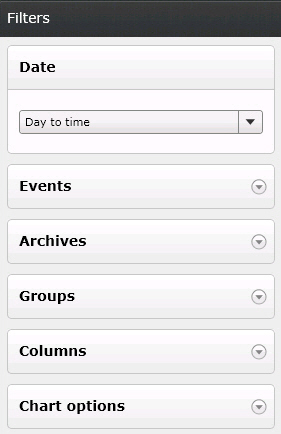
A report is designed by choosing a time span (under the Date node shown above) and then choosing which Events, Archives and Groups you want to include in your report. You can also enable additional columns that you want to include in the report by selecting these under the Columns header.
If you cannot find the metadata fields or events that you would like to include in your report, chances are logging has not been enabled for these fields/events. In that case, read more about enabling and disabling event and metadata logging here.
If you would like to group your report by one or more columns, just drag that column up a notch to the Grouped by: area. When data is grouped you have the possibility to choose which type of chart you want to include in your report - you can choose between a bar chart and a line chart from the Chart options node in the right panel. Grouping can for example be useful for instance to monitor the number of downloads per archive or per company.
A note concerning the grouping of data:
When data is grouped, say, e.g. by Event, the different events will be spread over a number of pages in the data preview pane. Hence, you may need to switch pages in the preview panel to be able to expand and preview the data listed under a certain event.

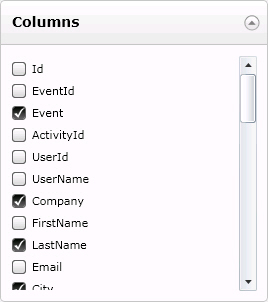
Having picked a date range and which archives and groups you want to include in the report, you can enable additional columns with information that you might like to include by expanding the Columns node.
The columns you can choose from here are determined by the Activity logging setting in the FotoWeb site properties. Make sure Write to database is enabled there, and that Write IPTC to database is enabled if you wish to include additional metadata fields in your reports. Then tick off the fields you want to write to the database. These fields will then be exposed in the Columns node in the report designer when they have been populated with data.
Note: The Source, Byline and Object Name fields are used in the standard reports. Hence, logging of these fields is enabled by default in the Activity Logging section in Site Settings. While it is technically possible to disable logging of these fields, we strongly advise against it since doing so will render the standard reports useless.
To name you report, click on the report name in the black field in the top of the designer (the default name is New report). Then click in the white field that shows on the right to fill in the report name.
Then make sure you click on the Save button to save the report. Use the Back button in the designer (NOT your browser's Back button) if you want to go back to the Reports screen.

From the Reports screen, click on the Play symbol next to the report you want to run. Be advised that if you have made a complex report with much data, generating the report could take a considerable amount of time and occupy much system resources. A spinning wheel will indicate that the report is being made, and when it is complete the last run date will be updated. Clicking on the last run date link will open the HTML version of the finished report.

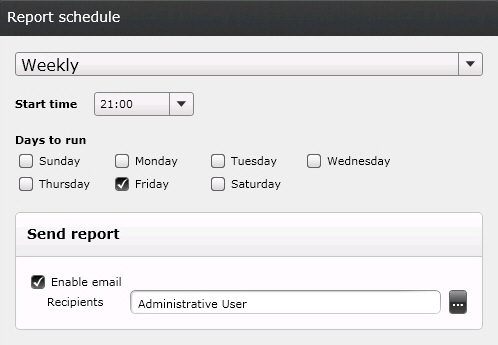
Reports can be scheduled to run at a preset time. To do so, click on the red and white Calendar button on the Reports screen. The right panel will change to let you choose the scheduling options:
Disabled: No scheduling is activated for the selected report. The report must be run manually by clicking on the Play icon in the left panel.
Daily: Set up a daily schedule at a given time of day.
Weekly: Choose which day(s) to run the report and the time of day it should run.
Monthly: Choose which months and days in the month the report should run, as well as the time of day you would like to schedule it for. By choosing Last, the report will always be run on the last day of the month, regardless of the number of days it has.
Tip: When a schedule has been set for a report, the schedule button is red. A report without a set schedule is gray. This makes it easy to see whether your reports have active schedules.
When setting up a report schedule you can optionally enable email delivery of the report in HTML format. The email also contains links to download the XML and CSV versions of the report for use in third-party systems such as an accounting system.

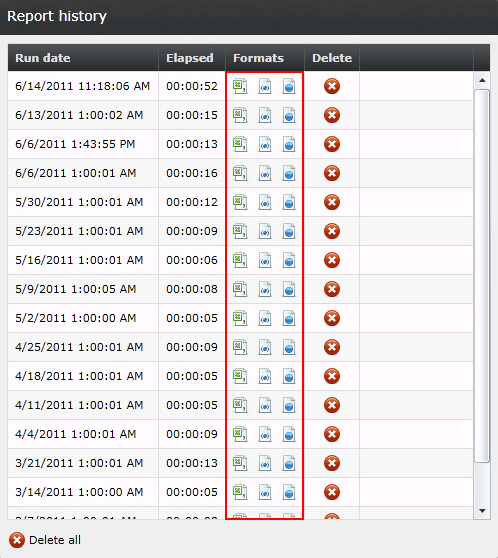
A ready-run report is stored in HTML, XML and CSV formats. The XML and CSV formats are practical for exporting the data to other systems, and may for instance be imported into your accounting system for invoicing of customers based on which files they have ordered from the system.
To download the report in HTML, XML or CSV format, click on the report you want to export in the Custom Reports list and then click on the format you would like to download in the Formats column in the Report History area on the right. You will then be given the possibility to save the file to disk for use in another system.